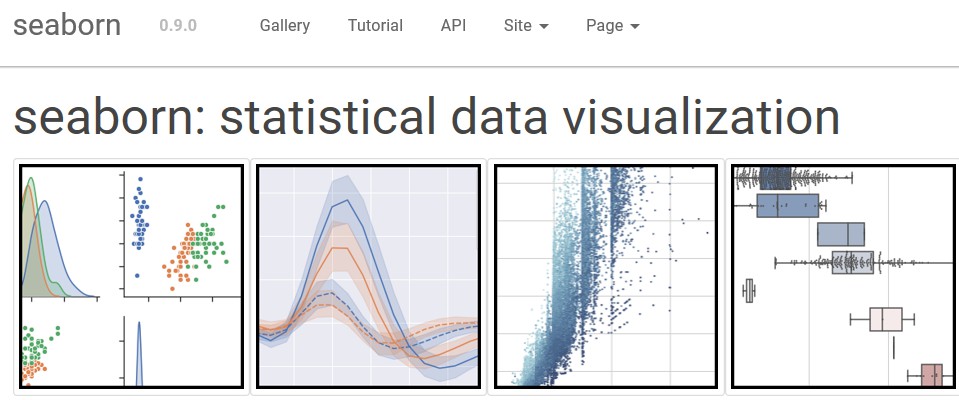
New package for data visualization. This package is base on the matplotlib, numpy, scipy , and pandas. The shining point is that this package is easier for people to create a beautiful picture for your dataset, this is essential for the data science. So let’s get it. This is the official URL: http://seaborn.pydata.org/
You can turn to there for help.
目录
Step0:什么是seaborn
- Seaborn是基于matplotlib的图形可视化python包。它提供了一种高度交互式界面,便于用户能够做出各种有吸引力的统计图表。
- Seaborn是在matplotlib的基础上进行了更高级的API封装,从而使得作图更加容易,在大多数情况下使用seaborn能做出很具有吸引力的图,而使用matplotlib就能制作具有更多特色的图。应该把Seaborn视为matplotlib的补充,而不是替代物。同时它能高度兼容numpy与pandas数据结构以及scipy与statsmodels等统计模式。
- seaborn 有五种风格,分别为”darkgrid”, “whitegrid”, “dark”, “white”, “ticks”
